AdLibbing Articles

Launching on Roblox: Insights from the "Love, Your Mind World"
On March 5th, the Ad Council launched the Love, Your Mind World on Roblox—the first nonprofit experience dedicated to supporting teen mental health on the platform. Developed with guidance from leading mental health experts, this immersive world was designed to meet teens where they already are spending their time, while equipping them with valuable mental health resources in a safe and engaging environment. The new experience is available at www.roblox.com/loveyourmind. You can view a trailer video here.
April 4, 2025

“Agree to Disagree” Ends a Conversation on Gun Violence. “Agree to Agree” Starts One.
One year ago, we announced the launch of the Ad Council’s Gun Violence Prevention Initiative—an expansion of our long-time commitment to address this health crisis. This multi-faceted effort was designed to support the life-saving work already happening across this space. We knew then what remains true today: no one organization or individual can address this crisis alone.
April 2, 2025

Innovation, Impact and Serendipity: SXSW 2025 Through the Lens of Emerging Tech and Creativity
SXSW is always an energizing experience—a melting pot of creativity, technology and collaboration where some of the most meaningful conversations happen in the most unexpected ways. This year was no different. Over three whirlwind days in Austin, I had the opportunity to speak on two thought-provoking panels, engage in insightful discussions with industry leaders, and immerse myself in groundbreaking activations that showcased the future of gaming, AI and immersive storytelling.
March 14, 2025

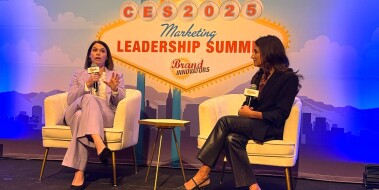
Innovation and Urgency: CES 2025 in the Shadow of the California Wildfires
As I reflect on my experience at CES, I know that this year is one I’ll never forget.The groundbreaking technology I encountered and the inspiring conversations I had were all taking place while the devastating wildfires swept through Los Angeles, in my home state of California. At the time I’m writing this, the fires remain uncontained, destroying over 57,000 structures and forcing the evacuation of more than 153,000 residents. Needless to say, this cast a somber undertone over CES–many attendees, including several of my colleagues, were personally impacted and had to fly out to support their families.
January 13, 2025

Join Us for Advertising Week New York 2024
Get ready for Advertising Week New York, where the brightest minds in the industry come together to push boundaries and explore the future of marketing, media and tech. This year, we’re proud to participate in two dynamic panels that highlight the power of creative storytelling and how we’re shifting perceptions around the most critical issues of our time.
September 26, 2024

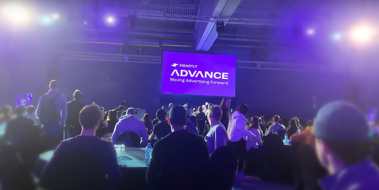
Advertising for Good: Shaping the Future of Mental Health at Smartly Advance
At the Ad Council, the phrase “advertising for good” isn’t just a tagline—it’s the core of everything we do. This concept resonates deeply across our industry, and we’re fortunate to collaborate with some of the most innovative platforms that share our commitment to leveraging advertising for positive change. To bring this topic to life, Ad Council’s President and CEO, Lisa Sherman, and Smartly CEO, Laura Desmond, will lead a panel called, “Advertising for Good” at Smartly Advance.
September 5, 2024

Cannes Lions 2024: A Week of Inspiration, Learning and Connections
My first experience at the Cannes Lions International Festival of Creativity was nothing short of transformative. Imagine the energy of a music festival combined with the intellectual stimulation of an academic conference, all set against the backdrop of the stunning French Riviera. Major agencies, brands, tech and social media companies build pop-up activations along the beach—creating an atmosphere buzzing with creativity and innovation.
June 24, 2024

Get in the Game: Engaging Gen Z Gamers through Fan Favorites
Establishing an authentic connection with target audiences can be a game-changer in delivering nuanced critical messages. Together, with our partners, we took this approach in a recent collaboration to reach young adults. By tapping into the existing level of trust in the video gaming community, we were able to create genuine connections and share important mental health resources. Join us for a deep dive as we discuss how Gen Z, a generation deeply immersed in gaming culture, found value in the authenticity of our message and how we engaged them using some unique trusted messengers.
May 23, 2024

From Awareness to Action: Leveraging WebAR for Social Impact
As the vice president of emerging media and technology at the Ad Council, I’m always exploring new and emerging technologies that can help drive impact across our many social cause campaigns. I was eager to explore web-based augmented reality (WebAR) as a way to reach people with our messages and after months of building, we just launched our first WebAR partnership with our long time partners at Feeding America. For those of you unfamiliar with this technology, WebAR enables users to interact with digital graphics superimposed onto their real world environment through a web browser, without the need for a dedicated app. The user gets to this experience through scanning a QR code or tapping through to a website. This accessibility makes WebAR a powerful tool for marketers, enabling a broad audience to seamlessly access the experience across various devices. The immersive nature and gamification of a WebAR experience can boost engagement, making complex messages more resonating and impactful.
May 15, 2024

How the Creator Economy is Driving Social Impact
Last June, in partnership with Whalar, the Ad Council’s Creators for Good team–our premier in-house talent engagement arm–launched an Ambassador Pilot Program to foster deeper connection with multi-hyphenate content creators passionate about social impact.
May 9, 2024

The 7 Most Talked-About Moments from Social Media Week
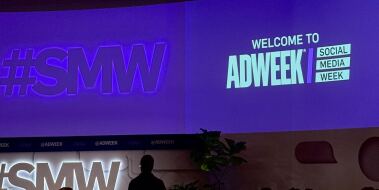
In the ever-evolving social media landscape, staying ahead of the curve isn't just a goal—it's a necessity. From social media managers leading day-to-day operations to CMOs directing marketing strategy, brands understand that to stay relevant they must make an investment in social. And events like AdWeek’s Social Media Week are crucial for keeping brands at the forefront of industry trends and innovations.
April 18, 2024

Champion for Good: Mike Durham
Peachjar is a platform that is revolutionizing the way students access community resources and important initiatives. Through their partnership with the Ad Council, Peachjar has extended the reach and impact of campaigns, providing parents and students with valuable information on a variety of topics. We had the opportunity to chat with Peachjar’s CEO and Founder Mike Durham to learn about the importance of accessible student resources, his focus on students’ mental health and emotional-wellbeing, and insights on how to beat a chess master.
April 15, 2024

Gun Violence Is Now a Public Health Crisis
At the Ad Council, we always say we can’t possibly pick a favorite campaign—just like we can’t pick a favorite child. But sometimes an issue just gets inside you. You see that statistic, you see that headline, and your reaction isn’t just intellectual. It’s not even just emotional. It’s visceral. You feel it twisting in your gut. And as a mother, you feel it in your heart.
March 19, 2024

The Impact of Trusted Messengers on Marketing Strategies
In a post-COVID world, the creator economy is a reinvigorated space. Traditionally, messaging around sensitive topics like mental health, public health and gun safety were shared out by health organizations, government agencies or other trusted institutions. Today, influencers play a vital role in sharing important messages and driving meaningful change—reshaping how marketers partner with trusted messengers to address key social issues. Now more than ever, nano to celebrity influencers play a pivotal role in shaping online conversations and creating impact.
March 13, 2024

The Magic of Leading with Purpose: A HOW Conversation about Leadership with Lisa Sherman and Dov Seidman
We are in a time where unprecedented forces are reshaping our world faster than we can adapt our institutions, leadership and even ourselves. In recent years, we have faced challenges on all sides—a global pandemic causing suffering, death and economic destabilization; a reimagined workplace; technological advances that challenge human dignity and autonomy; a war in Ukraine and Israel that has shaken international alliances; and the rise of autocratic leaders across the globe.
February 5, 2024

Tech Trends with a Purpose: Key Takeaways from CES for Marketers and Social Impact Leaders
As the vice president of emerging media & technology at the Ad Council, I always look forward to attending CES, the most influential tech conference in the world—attracting over 3,000 exhibitors and 130,000 attendees, all showcasing breakthrough technologies that will shape our future. I love to learn how technology innovations are not only shaping the marketing industry, but most importantly solving the biggest challenges in our world today. Below are some of my key takeaways from 2024.
January 17, 2024

Stories from Detroit: How JPMorgan Chase Showcased a City’s Remarkable Comeback
“Detroit’s story is one of the greatest comebacks of all time,” says Jamie Dimon, Chairman and CEO of JPMorgan Chase. “Having served the city for more than 90 years, especially after it filed the largest municipal bankruptcy in U.S. history, we’re proud to share the successes and stories of Detroiters who helped make it happen.”
December 4, 2023

Centering Women Veterans in ‘Don’t Wait. Reach Out.’ Campaign
Veterans, whether they've recently left the military or served decades ago, have unique experiences and needs as they adjust to civilian life. They may struggle with challenges related to their service or face common stressors like physical or mental health challenges.
November 20, 2023

A Deep Dive on Our Substance Use and Overdose Crisis Work
In the United States, drug overdose deaths reached nearly 108,000 in 2021, the highest number ever recorded in a 12-month period and a staggering 52% increase compared to two years prior. Over the past 21 years, drug overdoses have claimed more than 932,000 lives. In addition, in 2021, 46.3 million people aged 12 or older in our country had a substance use disorder (SUD). However, less than 10% of these individuals report receiving care or treatment for their substance use.
November 16, 2023

5 Principles to Guide Your 988 Outreach and Messaging Efforts to Key Populations
Warning to the reader: This blog discusses various experiences that you may find yourself identifying with while reading. Should you need emotional or mental health-related support, please contact 988 or a local trusted support.
November 15, 2023

2023 Industry Takeaways from Advertising Week New York
Last week, we participated in Advertising Week New York (AWNY), an annual conference that unites the brightest minds in marketing, advertising, media and technology. The conference presented a remarkable opportunity for us to engage with industry experts and witness our own leaders and Board members address several pressing issues affecting the nation. Join us for a recap of AWNY, where we'll examine the key insights and creative innovations reshaping our industry, including the four pivotal themes that emerged.
October 25, 2023

Where to Find Ad Council During Advertising Week New York 2023
Join us for Advertising Week New York, the premier event for industry leaders to discuss and explore the latest trends, innovations and challenges in marketing, advertising, media and tech. As industry leaders gather, virtually and in-person, we are excited to host three engaging panels and feature our award-winning “Tear the Paper Ceiling” installation. Our experts will join key leaders to discuss harnessing creativity for impact and changing the narrative around substance use disorders.
October 11, 2023

Amazon's Creative Director Uses Music and Tech to Address Youth Mental Health
Go behind-the-scenes with Sara Wald, Creative Director at Amazon, as we delve into our collaboration to develop a powerful new resource focused on supporting the youth. Our interactive experience, "When You Can't Say It, Play It," serves as a tool for parents and caregivers to initiate conversations with teens through music. By leveraging technology to drive impact and connection, Amazon and the Ad Council are actively working to find new ways to address mental health and wellness. Gain insight as Sara shares the inspiration behind the experience, the impact of music on youth mental health, and the need for inclusive marketing.
September 28, 2023

Advancing Healthy Aging Initiatives and Alzheimer's Awareness in Hispanic Communities
In the Hispanic community, distinguishing between the natural process of aging and the early signs of Alzheimer's disease can be difficult to recognize. Healthy aging is a universal goal that transcends cultural boundaries and can take on various forms within different communities.
September 21, 2023

How and Why Mindshare Created an Intentional Media Library
Mindshare operates under a principle of “Good Growth”—a method for creating sustained client growth that goes beyond the focus of a single moment, sale, or platform. That’s because Mindshare believes that media agencies have the power to influence social change and is keen to push intentional media forward. The practice of intentional media investment is about aligning brand values with how brands invest their ad dollars. It is an enhancement to, not a departure from, existing planning processes. Intentional media matters, because moral decisions and business decisions cannot be decoupled. The media and content that brands surround and support with their investment has a real, human impact.
August 16, 2023

Shape the Conversation at SXSW 2024: Vote Today
Each year, Austin, Texas hosts the South by Southwest conference where the convergence of tech, film, music, education, and culture is showcased and celebrated. True to the innovative and collaborative spirit of the conference, SXSW relies on public involvement to help select their lineup using the SXSW Panel Picker. This platform allows you to browse proposals, leave comments and vote for the most important sessions.
August 8, 2023

Roblox: A Vehicle for Social Good
With generative AI and the metaverse at the forefront of emerging media conversations, Roblox cannot be ignored as a frontrunner in the digital experiences space. Having joined the online game platform myself in 2009, it has been fascinating to watch Roblox grow and mature over the years. And now, the platform is at a critical juncture. What started as a relatively small group of game developers and users has exploded into a vibrant community spanning the entire globe.
August 4, 2023

How to Design Life-Saving Health Campaigns with Gen Z in Mind
Gen Z, the generation born between the late 1990s and early 2000s, have revolutionized the way we think about campaigns and campaign engagement. With their inclusive mindset, digital fluency and emphasis on social good, Gen Z has emerged as the most influential demographic across industries.
August 2, 2023

Champion for Good: Kiron Chakraborty
Meet Kiron Chakraborty: the creative lead and director behind the latest round of videos produced in partnership with Upworthy, for our Belonging Begins With Us campaign. His passion for inclusivity and ensuring that diverse voices are heard has helped us produce creative that promotes a deeper sense of belonging throughout our nation.
July 18, 2023

5 Tips to Sharpen Your Crisis Communications Skills
In today’s divisive political landscape, it’s more important than ever to be prepared when it comes to crisis communications. With social media and ever-evolving technology, the demand for crises to be managed effectively and efficiently has only been amplified. Preparing in advance is vital to safeguarding your brand in challenging moments.
July 13, 2023

How to Facilitate a Successful Remote Internship
Internship season is here –and as full-time hybrid and remote roles increasingly become the norm, we are seeing the same for remote internships.
June 22, 2023

Saved by the Scan: How a Lifesaving Quiz Reached 1M Completions
Lung cancer is the leading cause of cancer deaths in the U.S. and has one of the lowest survival rates compared to other major cancers – but early detection through a new, low-dose CT scan provides lifesaving hope. According to the National Cancer Institute, when screening is used to detect lung cancer before it spreads, the likelihood of surviving five years or more improves to over 60%. However, although 14.2 million Americans are eligible, less than 6% of those at high risk for lung cancer have been screened. *
June 15, 2023

Where We’ll Be at Cannes Lions 2023
From transforming hiring to mental health, we are proud to be taking part in conversations about some of the most important topics at Cannes Lions this year. Read below to learn more on where you’ll find us. We hope to see you there!
June 7, 2023

How to Center Accessibility and Inclusion in UX/UI Design
According to the CDC, 26% of people in the United States are currently living with a disability. And as of 2021, 95% of Americans utilize the Internet. What this data tells us is that if your organization is hosting content online, your audience includes those living with disabilities. In 2023, creating content that is accessible is a necessity—but creating accessible content benefits everyone, not just those living with disabilities.
May 18, 2023

Shades of Green: What Marketers Need to Know About Modern Greenwashing
I remember when I heard the term “green” for the first time. As a consumer, I felt empowered. I was motivated to support companies that prioritized people and planet – not just profit. As a marketer, I saw this as a breakthrough opportunity to reach new consumers and shift behaviors toward more sustainable options.
April 28, 2023

Community Leaders Share Tips to Meet the Moment
Each year, at our Annual Public Service Award Dinner, the Ad Council celebrates the leaders and organizations that make our social impact campaigns possible. The Annual Dinner is an opportunity to showcase not only the campaigns moving the needle on today’s most pressing issues, but the dedicated community heroes who bring those efforts to life daily.
April 10, 2023

Five Trending Topics We Saw at SXSW 2023
Last week, I flew to Austin, Texas to attend South by Southwest, which brings together innovators in media, tech and entertainment. I was excited to see my Ad Council colleagues speak about the power of partnerships for our Seize the Awkward campaign at the SHE Media Future of Health Co-Lab and host a panel on the power of championing skills-based hiring to revolutionize and diversify the workforce. And with over 25 tracks of programming, SXSW 2023 was a fascinating place to get insights on everything from GPT-4 to ethical AI and accessibility in tech. Here are the top five topics that fascinated me at this year’s festival.
March 23, 2023

Prioritizing Mental Health Conversations in the Workplace
According to a recent Ad Council study, 95% of employees take time off due to mental health issues but cite another reason.
March 17, 2023

Champion for Good: Denise Lee
Denise Lee is a volunteer spokesperson for the American Lung Association (ALA) and a lung cancer survivor. Denise recently worked with us as a spokesperson on our Lung Cancer Screening campaign. Ahead of World Cancer Day, we had the opportunity to chat with Denise about her experience as a survivor and advocate. She also shared her advice for those looking to spread awareness about issues they care about.
February 3, 2023

CES 2023: Where Technology Met Social Impact
With over 3,000 exhibitors and 115,000 attendees, CES is the most influential tech conference in the world, showcasing breakthrough technologies that will shape our future. I’ve spent most of my career at the Ad Council, building relationships with social media companies to develop and scale impactful and innovative partnerships. Since June, I’m leading a new center of excellence focused on emerging media and technology. Given this new focus, I was eager to learn about future technology shaping how we consume media and drive impact. Here are my top highlights from CES 2023.
January 18, 2023
